Restoring a True Safety Net
The Obama years have seen unprecedented growth in spending on what used to be known as the federal "anti-poverty" or "welfare" programs: means-tested initiatives to provide food, health insurance, housing benefits, and income support to the poor. These programs certainly grew during the Bush administration, with spending increasing by a total of about $100 billion over that eight-year period ($12.5 billion per year in 2010 dollars). But that spending increased another $150 billion in just the first two years of the Obama administration.
The scale of these increases is staggering. In three years, from 2008 through 2010, total annual spending on welfare programs (in 2010 dollars) increased from $475 billion to $666 billion — a 40% increase after accounting for inflation. At a combined annual cost of two-thirds of a trillion dollars, these programs are now on the same scale as the defense budget ($693 billion), Social Security ($700 billion), and Medicare ($551 billion).
Some of these spending increases were justified by the deep recession that began in December 2007. Indeed, the American Recovery and Reinvestment Act (ARRA), or the stimulus program, specifically targeted poverty programs for greatly expanded funding. And, as in the recessions of the early 1980s and early '90s, the poverty rate climbed during the 2008 recession — to 15% from an average of about 12.5% during the mid-2000s. But this rise in poverty does not explain most of the recent increases in spending on anti-poverty programs.
Rather, it is the dramatic expansion of eligibility for these programs — spreading their benefits well into the middle class — that has driven the explosion of spending. Today, more than half of the benefits allocated through programs we think of as "anti-poverty" efforts actually go to people above the poverty line as defined by the U.S. Census Bureau. As a result, our poverty programs — once justified and defended as a safety net for Americans truly in need — exist, increasingly, to make life more comfortable for the middle class.
Clearly, if the United States is to control its growing budget deficit, the next Congress and president will have to seriously examine anti-poverty spending and bring these programs back into line with their original purpose. The good news is that, because of the ways in which federal anti-poverty benefits are currently distributed, policymakers can pursue fairly straightforward remedies. The fact that much of today's spending on anti-poverty programs goes to people who are not in fact poor means that resetting eligibility requirements can yield significant savings — and thereby help restrain the growth of federal deficits and debts.
By carefully reviewing the data about safety-net programs — data that are not well known even among policymakers in Washington and that are, in some cases, analyzed here for the first time — we can understand the trends in welfare spending that have brought us to this point, and can find ways to significantly reduce federal spending without harming Americans who are actually in need.
DEFINING POVERTY
In the world of government programs, "poverty" is not a simple label. There is only one official definition of poverty, set by the U.S. Census Bureau and updated each year to reflect inflation. The most recent definition, for instance, set the poverty threshold for 2011 at $11,702 in annual income for a single person under 65 years of age, and at $22,811 for a family of four that includes two children. Most of our assessments use 2010 data, since these are the most recent available authoritative figures, and the 2010 definitions were slightly lower: $11,344 for a single person and $22,113 for a family of four.
The problem comes in applying poverty definitions, because Congress allows federal agencies wide latitude in determining eligibility thresholds. Federal "poverty guidelines" allow agencies to move the threshold up to 130% or 200% of the official poverty level. For reference, using a poverty threshold of 200% for a family of four in 2011 would have given poverty benefits to families earning more than $45,000 annually. Throughout this analysis, when we refer to the "poverty level," "poverty line," or simply "poverty," we mean the official federal definition of poverty as established by the U.S. Census Bureau, using annual income.
It is worth noting that average incomes and living costs differ significantly among the states. According to the Census Bureau, in 2010, the median income in Mississippi was $45,484; in Maryland, it was $83,137. Because of these differences, the federal government gives some leeway to the states to determine eligibility for anti-poverty programs, though there is only one federal definition of poverty, which is designed to reflect an absolute subsistence standard rather than one relative to incomes.
FEDERAL FOOD AID
With these facts in mind, it makes sense to begin our investigation with federal food programs — which, among the various anti-poverty programs that have grown in recent years, have seen the largest spending increase (as a percentage). Between 1992 and 2007, spending on food programs did not vary by more than a few billion dollars, after adjusting for inflation. But according to the Congressional Budget Office, spending on food programs rose from $57 billion in 2007 to $95 billion in 2010 (again, adjusted for inflation), an utterly unprecedented increase of 66%.
The two best-known federal food programs are the Supplemental Nutrition Assistance Program, or SNAP (formerly known as food stamps), and the school lunch and breakfast program. These are also the two largest food programs, accounting for approximately $68 billion and $14 billion, respectively, of the total federal funds spent on food assistance in 2010. The only other significant food program is the Women, Infants, and Children (WIC) program, which adds another $6.7 billion to the total. If we exclude administrative and other program costs and look only at direct spending on food benefits, we find approximately $65 billion in spending for SNAP, $13.5 billion for school meals, and $4.5 billion for the food-packages component of the WIC program.
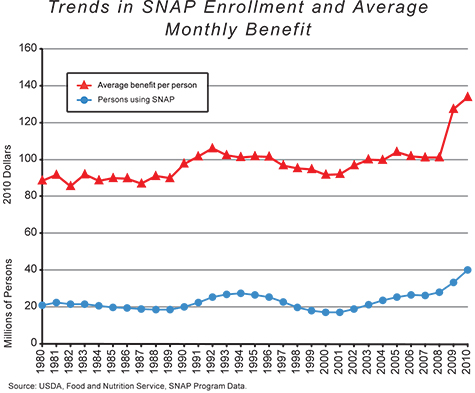
Between 2000 and 2010, the number of persons receiving food stamps more than doubled, increasing from 17 million to slightly more than 40 million. Real spending more than tripled during this period, rising from $22 billion to $68 billion. This huge increase represents a major break from the historical pattern: Between the early 1990s and 2005, adjusted for inflation, the relationship between SNAP expenditures and food-stamp enrollment was quite stable. This suggests that the average per-person benefit was relatively constant during this period, with only a modest period of growth during the early 1990s. Starting in 2009, however, the relationship changed dramatically, with spending on benefits climbing much more rapidly than the number of beneficiaries.
The relationship between enrollment and average benefit is illustrated in the figure below, in which monthly benefits are expressed in 2010 dollars. Note that the average monthly benefit per person was approximately $90 during the 1980s, and rose only to a little over $100 per month during the recession of the early '90s before falling back to $90 in the early 2000s. The benefit then rose again to $100 in 2003 and remained fairly level through 2008. In 2009, however, the average monthly benefit spiked to $127, and the next year it increased again to $134 per person.
The main reason for the increase in average benefits after 2008 was President Obama's 2009 stimulus program, which directed an additional $20 billion to the food-stamp program over five years, with the purpose of increasing per-person benefits. While the stimulus legislation stated that the increase in average benefits would be 13% in the first year, the official expenditure data reveal that the actual increase was much larger: 27%. SNAP expenditures in fact increased by $30 billion over the two years following the stimulus law.
It is important to note that food-price inflation played virtually no role in these increases, since there was very little change in food prices in 2009 and 2010. This means that the average monthly benefits for a SNAP-eligible family of four climbed from about $400 in 2008 to $536 in 2010 without any real intervening increase in the cost of food.
But the growth of spending on the SNAP program has not been purely a function of increased benefits per person. SNAP participation rates, too, have risen sharply. For more than two decades starting in the early 1980s, SNAP enrollment hovered around 20 million people. During the recession of the early 1990s, enrollment increased by several million — understandably, given that the poverty rate rose to 15%, roughly the same as the rate in this most recent recession. But between 2003 and 2007, when the economy was strong and poverty rates were relatively modest, SNAP enrollment nevertheless climbed to 26 million people. And after 2007, enrollment figures skyrocketed — climbing to 33 million people in 2009 and to 40 million in 2010.
What caused this unprecedented increase? There were 46 million people in poverty in the United States in 2010; if the increase in SNAP participation were attributable to more poor Americans' receiving food stamps, then we could conclude that the food-stamp program was working more effectively by reaching more people in poverty. Unfortunately, this is not what happened: Most of the increases in food-stamp participation in the past several years have instead resulted from an increase in benefits going to people above the poverty line.
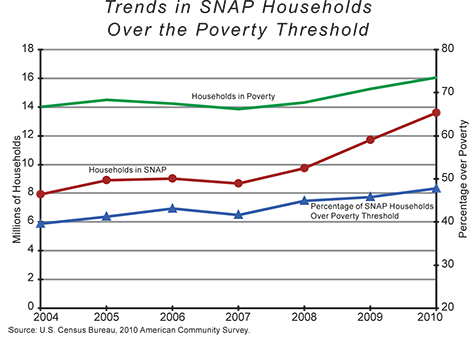
The figure above shows trends in the number of households in poverty, the number of households in SNAP, and the percentage of SNAP households over the poverty line between 2004 and 2010. As early as 2004, nearly 40% of households receiving food stamps were above the poverty line. The proportion of non-poor households receiving food stamps hovered just above 40% until 2008, when it rose to 45%. In 2009, the proportion rose to 46%, and in 2010 it reached 48% — nearly half of all households receiving food stamps. The increase in the number of households participating in the food-stamp program is thus being driven disproportionately by households above the poverty line.
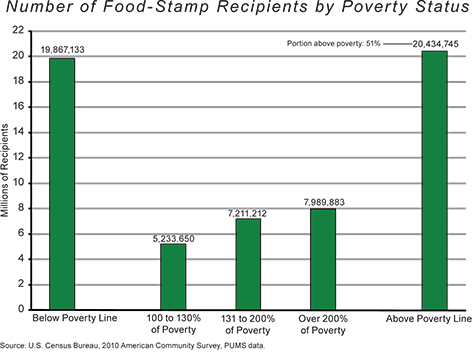
The trend is even more surprising when we look at individuals rather than households, using data from the 2010 American Community Survey Public Use Microdata Sample (PUMS) provided by the Census Bureau. The figure below shows the number of people receiving food stamps in different income categories; of the 40.3 million people receiving food stamps in 2010, slightly more than half, or 20.4 million people, were above the official poverty line.
One would expect some food-stamp recipients to have incomes above the poverty line, as Congress permits the SNAP program to set the eligibility threshold at 130% of the poverty level. What is remarkable, however, is the fact that, among recipients of federal food-stamp benefits, there are more people above the poverty line than below it.
Within the category of food-stamp recipients living above the poverty line, the breakdown into income sub-groups merits further consideration. Only about one-fourth of recipients in this over-poverty group — some 5.2 million people — have incomes between 100% and 130% of the poverty level, making them eligible for food stamps according to the Food and Nutrition Service guidelines. Another 7.2 million recipients have incomes between 130% and 200% of the poverty level, and an astonishing 8 million recipients have incomes that are greater than 200% of poverty. This means that 15 million Americans living above the food-stamp eligibility threshold established by Congress are receiving food stamps.
How did this happen? One possible explanation is that the SNAP program determines eligibility by looking at monthly income, while the PUMS data are based on 12 months of income. Obviously, by not counting income received prior to the past month, some people will qualify for food stamps when their current incomes fall below the poverty line, even if they earned, say, $50,000 over the previous 12 months. We investigated this possibility (using monthly data from the longitudinal Survey of Income and Program Participation), however, and found that the percentage of food-stamp recipients living above poverty remained very high (45%) when income was measured month to month.
A second explanation involves recent changes in the definition of so-called "categorical eligibility." Categorical eligibility allows states to declare large numbers of families eligible for SNAP without actually going through the SNAP program's own process for determining eligibility; families receiving in-kind benefits from the Temporary Assistance for Needy Families welfare program, for instance, are deemed automatically eligible for food stamps. Coupled with the fact that Congress allows states to use categorical eligibility for families with incomes up to 200% of the poverty line, this practice allows large numbers of non-poor persons to qualify for SNAP. In 2010, 12 states (Delaware, Florida, Hawaii, Maryland, Massachusetts, Michigan, Montana, Nevada, North Carolina, North Dakota, Washington, and Wisconsin) as well as the District of Columbia allowed benefits up to 200% of poverty. Another seven states (Arizona, Connecticut, Maine, New Hampshire, New Jersey, Rhode Island, and Vermont) allowed benefits up to 185% of poverty. Four states (Iowa, New Mexico, Pennsylvania, and Texas) allowed benefits up to 160% or 165% of poverty.
Increasing the eligibility threshold for federal benefits from 130% to 200% of the poverty line is an enormous change. According to census data, there are 38.3 million Americans between 130% and 200% of poverty; were the benefit threshold to be lifted to 200% of poverty nationwide, a total of 94.4 million Americans — nearly a third of the entire U.S. population — would be eligible for food stamps.
Fortunately, two of the largest states — California and New York — keep the eligibility limit at 130%, although Florida has adopted the 200% rule and Texas has adopted a 165% rule. Also fortunately, there are many people in these income categories who choose not to accept food stamps; otherwise, the program's participation rates and spending would be even higher. Nevertheless, calling SNAP a "poverty" benefit in states with a 200% rule is a serious misrepresentation.
Spending on the federal government's two other major food programs — the school lunch and breakfast program and the WIC program — is significantly lower than spending on SNAP. During fiscal year 2010, benefit spending was $10.8 billion for the lunch component of the school meal program, $2.9 billion for the breakfast component, and $4.6 billion for the WIC program. Total spending on these programs was therefore slightly more than $18 billion per year, bringing total benefit spending on the major federal food programs to $83 billion annually.
But these programs, too, have witnessed major expansion and growth in recent years. During the decade between 1995 and 2005, total spending for the school lunch and breakfast program grew by only $2 billion (in 2010 dollars). But it grew by that same amount again in just two years, between 2008 and 2010. Likewise, the WIC food program grew by only half a billion dollars between 1995 and 2005 (in 2010 dollars), but grew by roughly a billion dollars in the three years between 2007 and 2010.
With these programs, too, benefits are available to recipients well above the poverty line. For the school lunch and breakfast program, students are eligible for free meals if their family incomes are 130% of the poverty line or less; they are eligible for reduced-price meals if their family incomes are between 130% and 185% of poverty. Pregnant women, infants, and children under the age of five in the WIC program are eligible for food benefits if their incomes are at or below 185% of poverty.
With eligibility thresholds set well above the poverty level, the number of people enrolled in these food-aid programs who are not officially "poor" is significant. For the school lunch program, of the 17.6 million students receiving free meals, an estimated 4.9 million (28.1%) fall between 100% and 130% of poverty. Since the total cost of free meals is approximately $8 billion a year, this means that approximately $2.2 billion is going to students above the poverty line. Another 3 million students (those with family incomes between 130% and 185% of poverty) receive reduced-price lunches at a total cost of $1.1 billion. Finally, schools also receive subsidies for the 11 million students who pay for their lunches, adding another $1.7 billion to the cost of the school meal program. In total, approximately $5 billion a year is being spent to subsidize school lunches for non-poor children. Doing the same calculations for the school breakfast program, we find a total of approximately $1 billion being paid to support breakfasts for students above the poverty line. Finally, the WIC program has about 9 million participants, of whom approximately 31.4% are above the poverty line. This translates into about $1.4 billion in food benefits being paid to support women and infants who are not technically poor.
FEDERAL HEALTH PROGRAMS
Of course, food programs are by no means the largest component of our anti-poverty spending. The two major programs aimed at health care for the poor and nearly poor — Medicaid and the Children's Health Insurance Program — are far larger. Medicaid expenditures dwarf those for other poverty programs, making up nearly half of all anti-poverty spending. In fiscal year 2010, for example, federal Medicaid spending was almost $270 billion, compared to the $95 billion spent on food programs.
Fiscal responsibility for the Medicaid program is shared between the federal government and the states, and in FY 2010 the states paid out another $131 billion, bringing the grand total to $401 billion. The federal share of CHIP funding in 2010 added another $8 billion to federal spending on health-care programs for the poor; the states, meanwhile, contributed another $3.4 billion to CHIP. Our analysis here is concerned only with the federal share of Medicaid and CHIP expenditures, although clearly any changes in eligibility would affect state budgets, too.
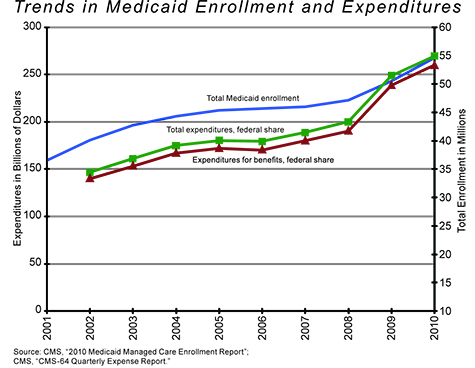
The figure below traces trends in Medicaid enrollment and federal expenditures. Enrollment rose steadily during the early 2000s but leveled off at 43 million in 2003 and rose gradually to 46 million in 2007. Very large enrollment increases occurred in the next three years, bringing the number of Medicaid beneficiaries up to 54.6 million in 2010.
These increases coincided with the slowdown in the economy, and can be attributed in part to poor economic conditions and rising unemployment during the 2008-09 recession. As in the case of the food-stamp program, however, budget and program changes initiated by the Obama administration also contributed a great deal to the increases in Medicaid enrollment.
Interestingly, while one would expect spending to rise in proportion to enrollment, the figure shows that, starting in 2007, expenditure growth began rising faster than enrollment growth, particularly in 2009. Consider that, in 2005, federal Medicaid benefits were about $3,800 per enrollee; in 2008, they were around $4,000. But in 2009 they jumped above $4,700 per enrollee.
This spike was caused primarily by changes to Medicaid made through the American Recovery and Reinvestment Act, which included $84.5 billion for a temporary increase in the Federal Medical Assistance Percentages (FMAP) for Medicaid from October 1, 2008, through December 31, 2010. The FMAP is the federal share of Medicaid spending. It is determined for each state by the state's per-capita income, and can vary from 50% for the wealthiest states to 76% for the poorest. But there is a delay in reporting the economic data used to determine the FMAP, which means that a state can sometimes see its FMAP reduced just as its economy is deteriorating. Under the ARRA, the level of each state's FMAP for FY 2009, FY 2010, and the first quarter of FY 2011 was held equal to at least the level of funding for FY 2008. In addition, each state received a one-time general 6.2% increase in its FMAP, and certain states with relatively high unemployment rates received additional one-time increases.
Enrollment in CHIP, too, has grown over the past decade, from about 2 million children in 1999 to about 7.7 million at the end of 2010. CHIP expenditures have grown correspondingly, from a federal share of $3.8 billion in 2002 to $8 billion in 2010; in per-capita terms, this means that spending increased from $708 per beneficiary in 2002 to just over $1,000 per beneficiary in 2010. Such growth should not have come as a surprise: The CHIP program was designed specifically to provide medical insurance to children who were above the poverty line but still considered "low income." The states have thus been given considerable flexibility in deciding what constitutes "low income."
There are no government reports that track changes in the number of Medicaid recipients by their poverty status. We can, however, analyze the poverty status of Medicaid recipients using the census data discussed earlier. Unfortunately, the data do not distinguish Medicaid recipients from CHIP recipients; this should not seriously affect the analysis, however, because the CHIP population is relatively small compared to the Medicaid population (8 million versus 54 million), and we know that CHIP enrollees are, generally, children who are above the poverty line.
These data allow for distinctions not only by poverty status but also by age and disability status. The disability distinction is especially important, because Medicaid has different eligibility rules for the disabled, and the program's expenditures (on a per-capita basis) are more than 4.5 times higher for the disabled population than for the non-disabled population. The data do not include the institutionalized population, such as people in nursing homes or other long-term group quarters; the enrollment and cost figures for the institutionalized population are thus presented and discussed separately.
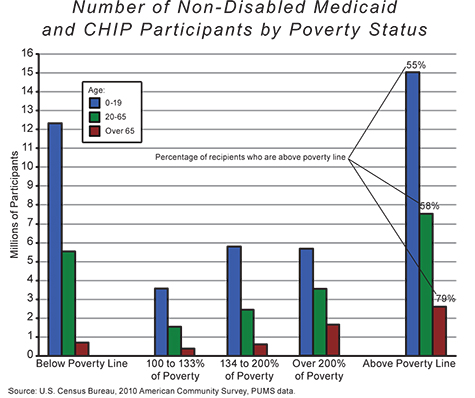
The figure above presents information about the 43.8 million non-disabled Medicaid and CHIP enrollees, broken down by age group and poverty status. From the chart, it is clear that most non-disabled Medicaid and CHIP beneficiaries are over the poverty line, regardless of age. Somewhat surprisingly, nearly 80% of the non-disabled elderly population — people over 65 — are above the poverty line, and about half are over 200% of poverty. One possible explanation for this is the practice of "income disregards" approved as part of welfare reform in 1996. These disregards allow states to subtract a portion of a person's or a family's income and not count it in determining eligibility for welfare benefits, including Medicaid. These practices vary by state, so there is no simple way to summarize their effect on raising eligibility thresholds. The elderly age group, however, constitutes the smallest share of non-disabled Medicaid enrollees — about 3.3 million people.
The next group of beneficiaries by size is the 13 million Americans age 20 to 65, 58% of whom are over the poverty line. It is not surprising that about 1.8 million non-disabled people in the 20-65 age group with incomes between the poverty line and 133% of poverty are receiving Medicaid benefits. After all, the program defines eligibility to include some non-disabled people up to 133% of the poverty level. What is surprising, however, is that 5.7 million people in this age group are living above 133% of poverty — a figure that represents 13% of all non-disabled Medicaid recipients, and 44% of all non-disabled recipients in the 20-65 age group. Of that group, 3.5 million — nearly 8% of all non-disabled Medicaid recipients — have incomes in excess of 200% of the poverty level.
Finally, more than half of the total non-disabled group, or about 27 million people, are children (up to age 19), 55% of whom are not in poverty. Of the 11 million children receiving federal health benefits who are above 133% of poverty, it is reasonable to assume that 8 million are CHIP beneficiaries. About half of the children in this group, more than 5.5 million, are over 200% of poverty. This is a direct result of many state policies that offer CHIP benefits to children well above the poverty threshold.
The 14.6 million Medicaid recipients who are disabled break down into similar categories. Again, more than half of each age group lives above the poverty line, including nearly three-fourths of the over-65 group. Among disabled participants in the program, the largest age group is 20-65, which accounts for about 8 million people. Not surprisingly, the smallest age group is 0-19, numbering just 2.3 million enrollees. About 2.3 million disabled persons in the 20-65 age group are between 100% and 200% of poverty, the result of federal rules that allow Medicaid enrollment of disabled persons up to 200% of poverty. Surprisingly, however, more than 2 million people in this group — 27% of the total — have incomes over 200% of poverty. Again, this might be caused by state waivers and income disregards, but we do not have data on that point.
This means that a significant portion of the cost of the Medicaid program involves health coverage for Americans who are not in poverty. Using data from the census and the Department of Health and Human Services, we estimate the federal cost for non-disabled persons who are below the poverty line to be $27.8 billion, while the federal cost for non-disabled persons who are above the poverty line is substantially higher: $40.3 billion. Equally important, of those Medicaid benefits for non-disabled persons over the poverty line, only $9.5 billion go to people in the 100-133% category, the level that is explicitly allowed in federal guidelines. The remaining benefits, or nearly $31 billion, go to people over 133% of poverty; more than half of that amount, or $18.4 billion, goes to people whose incomes are over 200% of poverty.
The Medicaid rules allowing benefits for disabled people with incomes up to 200% of poverty may well be reasonable, given the more limited employment opportunities and the substantially higher health-care costs faced by the disabled population. The program spends $55.3 billion in federal funds on disabled Americans who are below the poverty line, and $89 billion on those above the poverty line. But of that latter amount, nearly half, or more than $43 billion in benefits, goes to disabled people whose incomes are more than 200% of poverty — and thus higher than the threshold set out in federal law.
FEDERAL INCOME ASSISTANCE
Unlike food and health programs, which offer in-kind benefits or services, income-assistance programs provide direct monetary benefits — in the form of cash payments, tax credits, or refunds (even when no taxes are due). There are three major income-assistance programs: family-support payments, mostly through the Temporary Assistance for Needy Families (TANF) welfare program; the Earned Income Tax Credit (EITC); and Supplemental Security Income (SSI).
The TANF program replaced the Aid to Families with Dependent Children welfare system in 1996. The purpose of TANF is, as the name suggests, to provide temporary support to families with children; under the program, federal funds go to states, which in turn dispense the money to recipients. According to the Department of Health and Human Services, in 2010, TANF spending on direct payments to families was $17 billion. (Another $4 billion was spent on child care and the relatively unrestricted Social Services Block Grant program to states.)
TANF payments were given to 4.4 million people in 2010, compared to 4 million in 2009, 3.8 million in 2008, 3.9 million in 2007, and 4.2 million in 2006. While on an upward trend in recent years, these numbers overall are slightly down from the figures of the early 2000s, when the number of recipients generally averaged 5 million.
While both SNAP and Medicaid policies allow states some flexibility in modifying federal eligibility standards, states have much more latitude in establishing TANF eligibility requirements. Federal guidelines do give priority to families with children, specify a lifetime maximum of five years for TANF support, and impose work requirements for most recipients. But they do not mandate specific income limits for TANF; those are determined by the states. It is therefore very difficult to describe income requirements for TANF benefits without looking at the regulations in every state, and these regulations are exceedingly complex. Suffice it to say that, under these regulations, qualifying incomes can go as high as 250% of the federal poverty threshold (as in New Jersey) and as low as 130% of the threshold (as in Virginia).
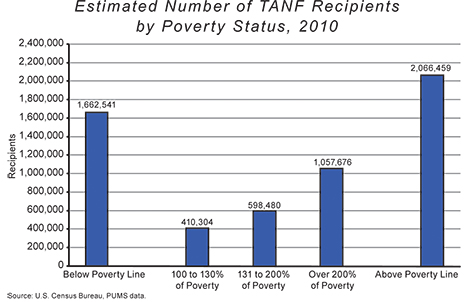
We again turn to the census data to estimate the number of TANF recipients and benefit payments by poverty status. The figure above shows the number of people in the 2010 PUMS sample who received public income assistance during the prior 12 months. It is worth noting that these data show 3.7 million Americans receiving TANF income, which is significantly below the 4.4 million figure reported in HHS records. The discrepancy cannot be explained with certainty, but part of it may be attributable to the fact that the PUMS data do not account for people in group quarters, such as shelters or nursing homes. Another part of the explanation may lie in under-reporting — common in all census surveys.
According to the data, more than 2 million people receiving TANF payments — about 55% — were above the federal poverty line in 2010. Of these above-poverty recipients, only about 400,000 were between — were above 200% of poverty. Estimated TANF benefits for people living above the federal poverty line total $8.9 billion, or two-thirds of all TANF expenditures. Spending on beneficiaries with incomes above 200% of the official poverty line amounts to some $5.6 billion – more than 40% of the program's total.
The Earned Income Tax Credit, meanwhile, has grown from one of the smaller anti-poverty programs into the largest of the income-assistance programs, reaching nearly $55 billion in 2010, according to the Office of Management and Budget. Its expansion was especially pronounced during the 1990s, when welfare reform limited TANF cash payments in favor of tax credits for the working poor and more mothers joined the work force. EITC was designed as an incentive for poor families to earn wages instead of relying solely on welfare payments.
According to IRS statistics, the number of EITC claims paid grew from around 19 million in 2000 to 27 million in 2009. In 2010, 26 million claims were filed, with payments totaling $58.6 billion in tax credits. (The likely reason claims fell in 2010 is that people lost jobs in the recession.)
It is somewhat misleading to compare the number of EITC payments with the number of people receiving other benefits such as food stamps and Medicaid, since one EITC claim can represent a family of two, three, or more people. Using PUMS data, we estimate that, counting spouses and children, the 26 million claims figure represents approximately 65 million people, or about one-fifth of the American population. Thus EITC payments may well be the largest of the poverty programs in terms of the number of people participating.
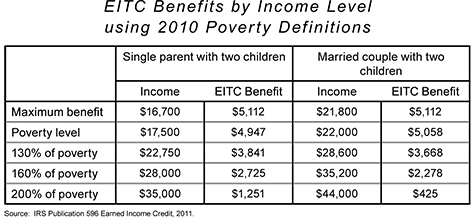
The following table, drawn from IRS data, shows EITC benefits at various income levels for two family compositions: a single parent with two children and a married couple (filing jointly) with two children. The IRS publication cited here shows quite clearly that EITC benefits are available at incomes substantially above the poverty line: While the maximum EITC benefit of $5,112 occurs just below the poverty level, benefits do not phase out until $41,000 for a single parent (just over 230% of poverty) and until $46,000 for a married couple (210% of poverty).
We used data from the U.S. Census Bureau's Current Population Survey, Annual Social and Economic Supplement for 2010, to classify EITC claims and benefits by poverty status.
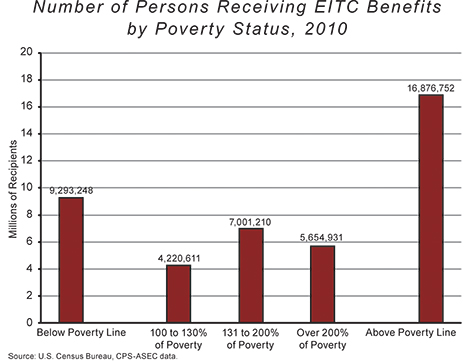
The figure below shows the number of people who received EITC benefits by poverty status for 2010. Approximately 17 million were above the poverty line, compared to 9 million below the poverty line, a rate of 62% — the highest rate of non-poor beneficiaries for any poverty program. Of those above the poverty line, the 7 million people in the 131-200% category constituted the largest group. About 20% of people receiving EITC benefits, or 5.6 million, have incomes above 200% of the poverty level.
Estimated EITC claims for people living above the federal poverty line total $35 billion; only Medicaid disburses more money to people with incomes in excess of the poverty level. Even if one accepts the 130% threshold as the proper cutoff point for benefits, EITC payments totaling $24 billion are provided to persons with incomes above that level.
The third major category of income assistance consists of the Supplemental Security Income (SSI) program, run by the Social Security Administration. SSI is designed to help blind, disabled, and elderly persons "who have low income and few resources" through monthly cash payments. According to the 2011 Annual Report of the SSI program, a total of 7.5 million people received SSI payments in 2010, and SSI benefit payments (from federal funds) totaled $47.8 billion that year. States provide additional benefit payments to federal SSI recipients based on a variety of criteria, though we have not identified data on the amounts of such aid.
Eligibility for SSI is determined both by income and by resources. According to the Social Security Administration, a person generally cannot have more than $2,000 (or $3,000 for a couple) in "resources," such as investments and property, though one home and one car do not count toward this limit. Earned income for recipients is capped at $17,700 (just over 150% of the poverty line), but many types of unearned income do not count (including goods and services received as gifts from others, as well as some government benefits, such as medical care or insurance premiums).
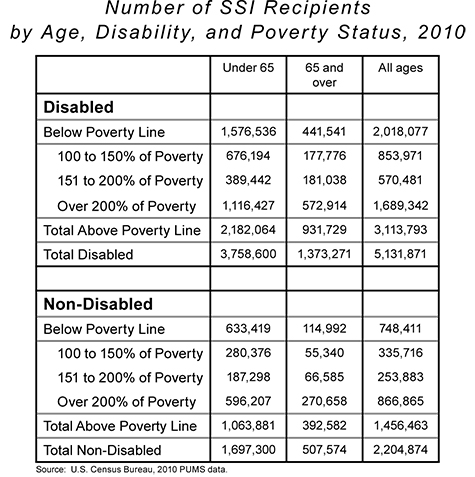
The 2010 census PUMS data include information about whether a person is receiving SSI benefits and the size of the benefit payments over the prior 12 months. This enables us to classify people according to age, disability status, and poverty category. The table above reports these findings.
The total number of SSI recipients based on the PUMS sample is 7.3 million persons, which is quite close to the official number of 7.5 million for 2010. This gives us some confidence regarding the breakdown by poverty status. About 70% of recipients are disabled, and another 5% are non-disabled persons over 65. Thus about three-fourths of SSI participants are receiving benefits in line with the stated purpose of the program.
About a million recipients are above the poverty line, are not disabled, and are under age 65. It is not clear what makes them eligible for SSI, unless it is a disease or condition that does not qualify as a disability but satisfies SSI rules. More important, however, is that about 4.5 million SSI recipients (60%) are above the poverty line, and 2.5 million of them (or one-third of the total) have incomes above 200% of poverty. The official program guidelines suggest that benefits should not be available to people with this level of income. Indeed, we estimate the federal share of SSI benefit payments going to recipients above the poverty line at $31 billion — which means that nearly two-thirds of all federal SSI payments are going to Americans above the poverty line.
HOUSING ASSISTANCE
Federal anti-poverty funding also includes housing assistance for people unable to afford rent on their own. Housing assistance accounted for slightly more than $50 billion in federal spending in 2010, making it the smallest of the four categories of programs discussed here. Housing assistance has several components, only one of which makes direct payments to individuals in the form of housing subsidies.
According to the Office of Management and Budget, only $19 billion of the $50 billion represented direct payments to individuals for housing assistance; the other $31 billion went to states as grants for housing programs. We do not have detailed information about how that $31 billion was spent, including how much might have been spent on payments to individuals for housing subsidies. We will therefore address only direct federal housing subsidies.
The best (and in some key respects only) source of information on how the $19 billion was spent comes from the American Housing Survey (AHS) sponsored by the Department of Housing and Urban Development. The AHS, which gathers information on housing throughout the country, interviews residents of about 55,000 housing units every two years (in odd-numbered years). According to HUD, the 2011 AHS data will be available late in 2012; the most recent available AHS data, therefore, are from 2009.
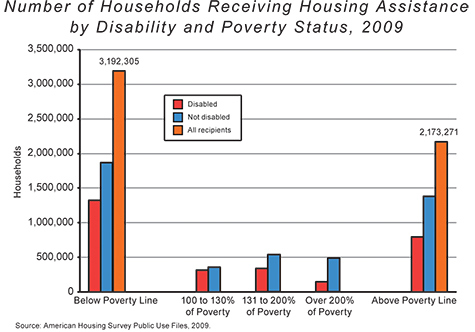
The figure below shows that, in 2009, an estimated 5.3 million households received a housing subsidy; of these households, 2.2 million, or 41%, were above the poverty threshold. While this portion of non-poor beneficiaries is significant, it is the smallest of all the poverty programs we have evaluated.
Somewhat surprisingly, about 40% of all households receiving a housing subsidy had a disabled member, which is the highest rate we have observed in federal anti-poverty programs (other than SSI, which exists to serve the disabled).
The AHS reveals that average housing subsidies are higher for persons below the poverty line than for those above it. This means that the share of federal housing dollars going to Americans below the poverty line is even larger than the portion of all housing-subsidy recipients who are below the poverty line. Of the total payments for housing subsidies identified in the AHS, $10.4 billion went to households below the poverty line in 2009, compared to only $4.4 billion for households above the threshold. Housing programs are thus much better at directing their subsidies to the poor than are the other federal poverty programs.
POTENTIAL SAVINGS
After the 1996 welfare reforms were implemented, spending on the major poverty programs reviewed here experienced only modest gains (in real terms) during the remainder of the Clinton administration. Poverty-program spending accelerated by about $100 billion during the Bush administration, primarily for health care, including Medicaid and CHIP. But poverty-program spending exploded by $150 billion in the first two years of the Obama administration, with significant growth in all four of the major poverty-program categories. Some of these recent increases were driven by the 2009 stimulus, and it remains to be seen how much of that emergency spending will remain in place more permanently.
As we have seen, these increases in spending are not primarily the result of the growth of poverty in America in the wake of the Great Recession. Between 2008 and 2010, anti-poverty spending per person in poverty for the major programs analyzed here increased by $1,800, from $12,800 per person to $14,600 (in 2010 dollars). This means that, on a per-person basis, yearly poverty-program spending is now substantially higher than the annual income required to place a single person above the poverty line — around $11,000.
But, as we have also seen, not nearly all of that money has gone to the poor. As documented above, more than half of the spending for food programs, Medicaid, EITC, TANF, and SSI now goes to Americans above the poverty line, when poverty is defined by income over a 12-month period. Although the food-stamp program defines poverty on a monthly basis, we also showed that, even using this more generous definition, 45% of recipients are over the poverty line. While some of these above-poverty expenditures are for disabled persons who are, quite reasonably, subject to more liberal eligibility requirements, our evidence shows that substantial portions of these expenditures benefit non-disabled persons and families with incomes well above the poverty level. If these poverty programs restricted benefits to people below, or at least much closer to, the poverty threshold, the federal budget savings would be considerable.
To be sure, there are critics who argue that the poverty threshold is no longer an adequate measure of need in our society. Some contend that the threshold is too conservative and that a modernized poverty measure, such as the U.S. Census Bureau's Supplemental Poverty Measure, should be used instead. This measure is based on a relative definition of poverty, using the 33rd percentile of expenditures for food, clothing, shelter, and utilities, and multiplying by 1.2. For a family of two parents and two children, the SPM is approximately $24,300, which is about 10% higher than the current official measure. Others argue that it does not make sense to apply the same poverty measure to all Americans, making allowances only for age and family size, since people's circumstances vary enormously.
It is beyond the scope of this essay to evaluate alternative poverty measures. But in our summary of potential savings, we take these concerns into account, showing the savings to be achieved by limiting eligibility not only to the poverty level but also to 130% of poverty (133% for Medicaid and 150% for SSI), addressing the concerns of those who believe that the current poverty threshold is too low. (The cutoffs at 130%, 133%, and 150% are the current federal official thresholds for most poverty programs.) We also discuss a somewhat more conservative allowance of 110% of poverty, which comes closer to the threshold suggested by the SPM.
As for the differences in people's individual circumstances, we of course cannot evaluate all of them (nor, for that matter, could any government program). It does seem reasonable, however, to adopt different standards for disabled Americans, given the effects of disability on earnings and health-care costs. Accordingly, we will use a 200% of poverty threshold for disabled persons in the Medicaid and SSI programs.
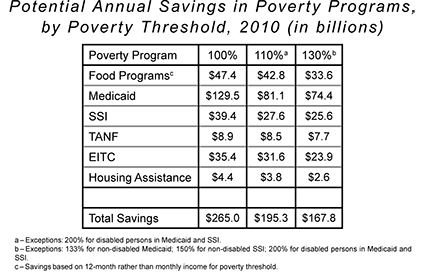
It is useful to begin by estimating the savings to be achieved in each of the programs discussed above. In the case of food programs, which have experienced the largest percentage increase of all the poverty programs in the past several years, the savings to be reaped are substantial. Limiting eligibility to people who are actually in poverty, and having benefits grow with inflation (rather than through arbitrary injections of funds), would yield about $47.4 billion in annual savings (based on 2010 data) — a figure equal to nearly half the total food-program budget of $95 billion. This figure is based on annual income; the savings would be about $4 billion less if monthly income were used.
Although some might disagree with requiring beneficiaries to be in poverty for 12 months, a one-month period may be too narrow, particularly if program administrators are not required to verify recipient income every month. A window of three to six months might be more reasonable, which would reduce the savings by $2 billion or so.
If the poverty threshold were set at 110% of poverty, savings would be about $42.8 billion. Allowing benefits for persons up to 130% of poverty would still save $33.6 billion per year — almost a third of the food-program budget.
Identifying the possible savings in federal health programs is, perhaps not surprisingly, more difficult. To achieve the greatest savings for Medicaid and CHIP, eligibility would be restricted to people below the poverty line — reaping a savings of nearly $130 billion a year. But in the case of Medicaid, there is a significant complicating factor: namely, the important distinction between disabled and non-disabled beneficiaries. Medicaid spending for disabled enrollees is, on average, more than 4.5 times higher than spending for the non-disabled. Moreover, disabled recipients are more restricted in their employment income and insurance benefits, further compounding problems in obtaining adequate health insurance in the private sector. They should thus be treated very differently by policymakers seeking savings in the program.
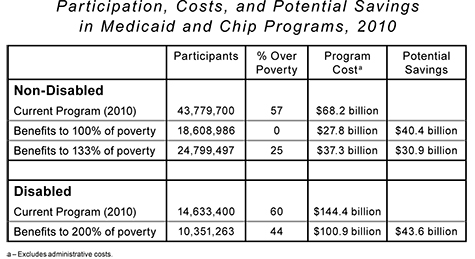
The table below therefore shows potential savings in Medicaid using two scenarios for the non-disabled and one scenario for the disabled. For non-disabled beneficiaries, if benefits had been offered only to those at or below the poverty line, 2010 savings would have amounted to just over $40 billion. If benefits had been extended to 133% of poverty — as current federal guidelines allow — but not offered to those above the 133% threshold, the 2010 savings would have been nearly $31 billion. Clearly, most of the potential savings in Medicaid are to be found by allowing eligibility to go to, but not beyond, 133% of poverty.
For disabled beneficiaries, the scenario illustrated assumes benefits extend to people who are at 200% of poverty — the limit prescribed in the federal guidelines. If this limit had been enforced in 2010, it would have resulted in savings of nearly $44 billion. Thus, based on 2010 figures, if Medicaid benefits were available only to people who met the current guidelines and not expanded beyond the official Medicaid rules (133% for the non-disabled and 200% for the disabled), the potential savings could amount to approximately $75 billion annually.
Our recommendation is a system that maintains Medicaid eligibility for the disabled population at the current official threshold of 200% of poverty. If Medicaid benefits were offered to non-disabled persons up to 100% of poverty, and to disabled persons up to 200% of poverty, the potential savings would be $84 billion per year based on 2010 expenditures. If Medicaid benefits were offered to non-disabled persons up to 110% of poverty, and to disabled persons up to 200% of poverty, the potential savings would be $81 billion per year. If benefits were offered to non-disabled persons up to 133% of poverty (keeping the 200% threshold for the disabled), the savings would add up to approximately $75 billion per year.
Identifying the savings to be achieved through direct income-support programs is more straightforward. In the case of Temporary Assistance for Needy Families, capping eligibility at 100% of the poverty level would produce $8.9 billion in annual savings. Limiting eligibility to 110% of poverty would save $8.5 billion annually; allowing benefits up to 130% of poverty would shave $7.7 billion off the program's annual costs. In the case of the Earned Income Tax Credit, limiting eligibility to 100% of poverty would generate $35.4 billion in annual savings; capping eligibility at 110% would save $31.6 billion annually; adopting a 130% threshold would yield potential savings of nearly $24 billion.
Determining the possible federal savings in the Supplemental Security Income program is less straightforward because it is necessary to distinguish between disabled and non-disabled beneficiaries. Of course, the greatest federal savings for SSI would be achieved if eligibility were restricted to people below the poverty line — a savings of nearly $40 billion a year. Our recommendation, however, is a system that maintains SSI eligibility for the disabled population at the current official threshold of 200% of poverty. If SSI benefits for non-disabled persons were capped at 110% of the poverty line, and for disabled persons at 200% of poverty, the potential savings would be $27.6 billion per year based on 2010 expenditures. If the current official thresholds of 150% of poverty for non-disabled people and 200% of poverty for the disabled were enforced, the potential federal savings would be $25.6 billion per year.
The last anti-poverty program, housing assistance, offers the smallest potential savings. Restricting benefits for those below the poverty line would save just $4.4 billion annually. Capping eligibility at 110% of poverty would save $3.8 billion. Allowing benefits up to 130% of poverty would save $2.6 billion.
The potential savings for each program are summarized in the table above for each of the scenarios discussed here (eligibility capped at 100%, at 110%, at 130%, and higher for some programs). In the cases of disabled Medicaid and SSI beneficiaries, a 200% threshold is assumed.
Overall, the most liberal scenario shown in the last column of this table, which corresponds to enforcing the current federal guidelines for each program, yields potential savings of nearly $170 billion a year. A somewhat more conservative scenario that is closer to the threshold suggested by the SPM would stop benefits at 110% of the official poverty line for all program recipients except disabled Medicaid and SSI beneficiaries (for whom there would be a 200% threshold); this would lead to savings of about $195 billion per year.
Over a ten-year period, the usual time frame for evaluating federal budgets, the potential savings from both options would exceed $1.65 trillion. Given the controversy that often surrounds budgeting, and the bitter fights over any proposed cuts, this finding is significant. It means that major savings are to be found without stoking class warfare or picking winners and losers among recipients of federal resources. We can both keep federal anti-poverty programs and take enormous strides toward bringing our long-term budget deficits and debt under control.
HELPING THE POOR
To be sure, reforms in this direction should not be implemented all at once. There are millions of individuals and families well above poverty thresholds who currently depend on benefits from one or more of the programs reviewed here; they will need time to adjust to any changes in eligibility. But Congress can easily begin the transition by applying tighter eligibility constraints to any new applicants to federal welfare programs, and by gently phasing them in for current beneficiaries over a period of five years or so.
The key to controlling our swiftly growing welfare programs is to think in terms of the purpose and not just the size of government. The idea that anti-poverty programs should help those who are poor is so obvious as to be a tautology. And yet — as the data above illustrate clearly — this is not at all how our federal anti-poverty programs work today. By bringing these programs into line with their original, stated aim — providing a safety net for people who are actually poor or who have serious disabilities — enormous budget savings can be realized. And because our massive debts put all federal programs in danger, making the reasonable reductions outlined above will actually put our welfare programs on more sustainable long-term footing. In so doing, it will also preserve a true safety net for Americans in need.
