Does High Voter Turnout Help One Party?
In the aftermath of the 2020 election, Republican and Democratic lawmakers squared off in several states over the conduct of elections. From Georgia to Texas, Arizona, and beyond, Republicans introduced bills to "enhance election integrity," while Democrats bitterly resisted efforts to "suppress access" to the polls. These debates were an extension of those that took place in the summer and fall of 2020, when public officials attempted to carve out a path for voters to participate safely and confidently during the Covid-19 pandemic while limiting the possibility of electoral malfeasance.
Though we should take these public officials at their word when it comes to their primary motivations, it's clear that there is a coincident partisan motivation for the parties' respective positions: Both Republicans and Democrats are convinced — and have been for some time — that higher turnout will help Democrats and hurt Republicans. The conviction is widely shared, but inaccurate. Put simply, there is no evidence that turnout is correlated with partisan vote choice.
The belief that higher turnout systematically benefits Democrats is ingrained in American political culture. It has become a go-to explanation for both the winning and the losing of elections. Candidates and parties understandably obsess over turnout, but often they also obsess over their opponents' approach to turnout in ways that assume both cynical motives and corrupt practices. Republicans are inclined to believe that fraud and illegal voting are frequent occurrences and organized (sometimes by campaigns themselves) to benefit Democratic candidates. The corresponding article of faith on the Democratic side is that Republicans scheme to reduce turnout because the latter also believe higher turnout brings more Democrats than Republicans to the polls. Republicans readily generalize from long-familiar anecdotes (some based in fact, needless to say) to the confident conviction that Democrats permit or even encourage illegal voting practices. Likewise, Democrats generalize from their preferred anecdotes (some true, to be sure) to assert that voter suppression is not only rampant, but the key motivation behind Republican proposals to revise election laws.
In what follows, we will not wade into the debate over whether voter fraud or suppression are generally widespread. But we will lay out substantial, reliable data indicating that turnout, in the range seen in the United States for the past 70 years, has little to no systematic partisan effect.
WHAT DRIVES VOTERS
The turnout myth is one of those rare assumptions that truly cross party lines in our polarized age. Underlying the myth is a belief shared by candidates and party apparatchiks — and endorsed by most of the media commentariat — that, all else being equal, voters who identify as Democrats turn out at lower rates than their GOP counterparts. Consequently, Republicans often cast an anxious eye at all proposals that might increase turnout, while Democrats readily embrace any proposal that might do the same.
Yet in the political world, "all else" is rarely equal. As a result, high turnout can help Republicans as often as it helps Democrats, while Democrats are often elected when turnout is lower than the norm for a given time or place.
The central finding in our research is what political scientists have long known yet often overlook: Turnout rates do not predict election results. Instead, results reflect the electorate's underlying partisanship, as well as the short-term forces (STFs, hereafter) of the moment. STFs include factors like the condition of the economy, the "performance" of the government, the occasional misfeasance or malfeasance of officeholders, negative or positive international events, and so forth. They reinforce or erode voters' otherwise powerful inclination to support the candidates of the party with which they identify.
Party identification is the baseline: About 80% of the vote in national elections (and higher shares in recent presidential elections) reflects party identification. The remaining 20% is contributed by Democratic and Republican identifiers who "defect" to the other party, and by political independents, who are particularly influenced by the relevant STFs. When STFs benefit Democrats, as they did in years like 2006 and 2008, Democratic identifiers vote more heavily than average for the Democratic candidate, Republicans defect by voting for the Democratic candidate at a higher-than-average rate, and independents (whose vote is not committed a priori) tilt strongly to the Democratic candidate. When STFs are on the side of the GOP, as they were in 1980 and 2010, the process is reversed: Democrats defect at a higher-than-average rate, Republicans are especially loyal, and independents vote heavily for the Republican candidate. These defection rates have a much larger effect on election outcomes than turnout rates.
This is not to say that Democrats and Republicans are equally likely to show up at the polls. Historically, Republicans have experienced a turnout advantage. They have also benefitted from greater loyalty to their expressed party identification. Democrats have displayed weaker ideological and issue commitments, and have thus been more inclined to defect than Republicans. The Republican-defection advantage seems to have declined during the last two decades, only to be replaced by a relative increase in Republican identification.
Things weren't always this way. The Democratic Party enjoyed a 20-percentage-point lead in party identification until the 1980s, with surveys reporting that Democratic identifiers were about 50% to 55% of the typical sample, while Republicans were about 30% to 35%. These data convinced Democrats that turnout was the key to electoral dominance, leading to much more vigorous efforts to contact voters and encourage voting. But this party-identification advantage has been reduced by half since the Reagan years, with the Democratic advantage in party identification hovering around 10 percentage points for the last couple of decades. It may be even lower now: The 2020 American National Election Studies (ANES) survey measured party identification at 46% Democratic and 42% Republican. This occurred in a year when Democrats won the presidency and majorities in both houses of Congress, meaning there was little election-specific boost to voters' identification with the GOP.
VOTER TURNOUT
The three lines in the figure below provide a baseline for discussing turnout. The line described as "VEP turnout rate" (the turnout of the Voting-Eligible Population) is the calculated turnout rate of those eligible to vote under the law. It eliminates from the denominator non-citizens and those who are institutionalized, and thus represents the best estimate of the turnout rate. The line described as "VAP turnout rate" (the turnout rate of the Voting-Age Population) is based on the population that is eligible to vote by virtue of age. It includes all Americans ages 18 and over, even if they are legally ineligible to vote. Finally, the figure also plots the number of individuals who have voted in each election from 1948 through 2020, just to clarify how the active electorate has grown over the past 70 years.
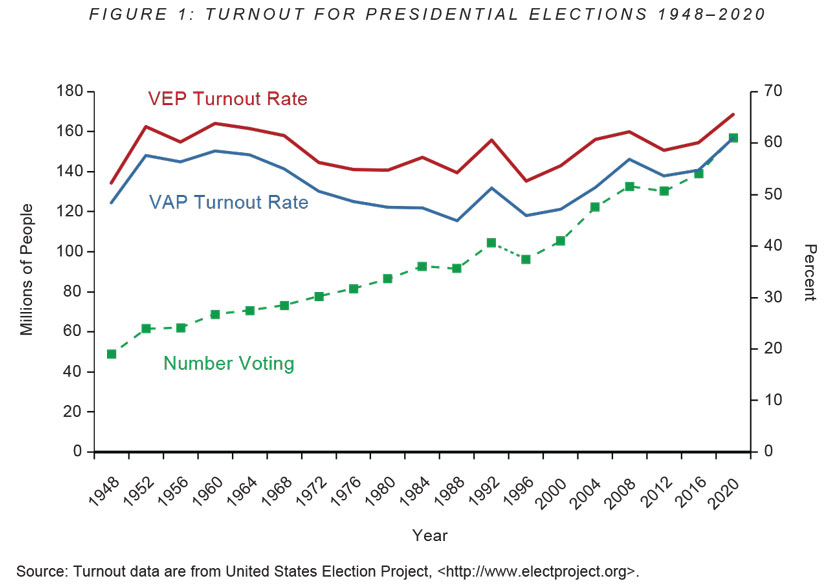
The figure does not present the turnout rate that registration officials most often report: that of those who are registered to vote. We chose not to include this rate because it fails to factor in the central act that must be accomplished prior to voting: registering to vote. Registration is part of the overall act of voting, and excluding those who fail to take this necessary step inflates the estimate of how many Americans participate in an election.
It is worth noting that registering to vote has become vastly easier in recent decades. In the past, voters were typically expected to register months before Election Day, and doing so often required a journey to a government office — sometimes a distant office — during regular business hours of the five-day work week. Today, registration booths and facilities are commonly scattered throughout a county and staffed by volunteers who are often linked to a party. Same-day registration, which effectively eliminates a registration requirement, is becoming more common. But these changes have not had dramatic effects on voter turnout.
DOES TURNOUT MATTER?
So how does turnout affect election outcomes? The short answer is that, over the last 70 years, it has had very little impact.
Consider turnout and the presidential vote choice. The figure below compares the turnout rate for each presidential election held from 1948 to 2020 and the percentage of the electorate that voted for the Democratic candidate.
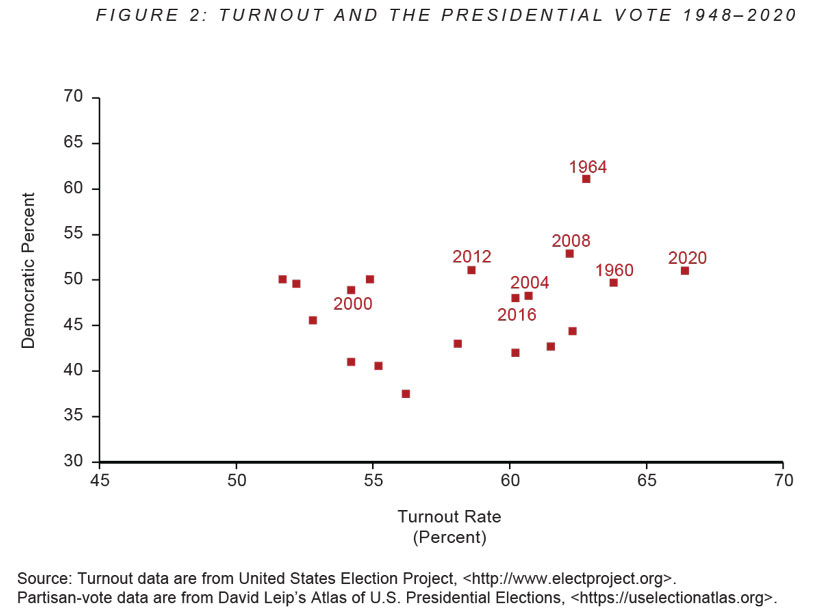
When we think of a cause-and-effect relationship, we expect to see ordered increases and decreases in the data. More specifically, we expect the purported cause to move in concert with increases and decreases in the expected effect. If turnout has an influence on the Democratic share of the vote, we would expect to see increases in the Democratic vote — maybe not a one-to-one increase, but definitely an increase — as the turnout rate climbs.
That is not what we find. Instead, we see something closer to a cloud of points indicating a broad, random distribution of turnout rates and the Democratic-vote share.
If a trend line were drawn though the points, it would be slightly positive — that is, it would weakly indicate that the Democratic vote share increased with turnout. Unfortunately for turnout-bias enthusiasts, most of that positivity is a product of the 1964 election — an anomalous election that distorts the data. If the single 1964 observation is deleted, the trend line is virtually flat (to put it in numerical terms, a 15-point increase in turnout "leads" to a one-point increase in the Democratic vote share).
Worse yet for the turnout-bias thesis, the spread of election points around the trend, with or without the 1964 election, makes the trend calculation virtually meaningless. The expected Democratic share of the vote as a consequence of turnout corresponds to almost nothing that is observed in the graph. For some years, the Democratic vote share increased when turnout increased relative to the last election, but sometimes it increased when turnout declined. In short, there was little to no systemic relationship between the turnout rate and the Democratic vote share over the last 70 years of presidential elections.
Eyeing the data might even suggest that the graph captures two discernible periods. The first is defined by a concentration of recent elections (since 2000), when the vote and turnout were flat but the Democratic vote was slightly higher than average. The second period is mostly made up of elections in the 1950s, 1960s, and 1970s, when Democrats fared less well. But again, there was no relationship between turnout rates and partisan outcome. The earlier period created what patterning appears in the figure — which, in any case, is almost non-existent.
The same absence of relationship between turnout and partisan outcome presents itself when we consider elections for other offices. The next figure includes an analysis of gubernatorial elections. Like the presidential figure, it involves a constant unit of analysis throughout the period (the nation for presidential elections, the state for gubernatorial contests). The figure distinguishes gubernatorial elections in presidential years, when turnout can be as much as 20 percentage points higher than it is during a gubernatorial election in an off year.
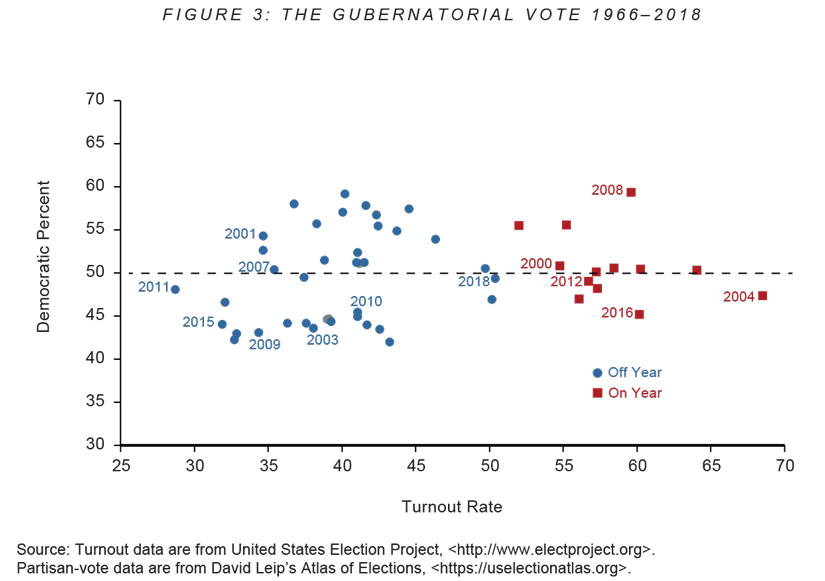
The results repeat the spread observed for presidential elections: No trend line among these points will allow an observer to confidently predict the Democratic gubernatorial vote share based on turnout. There is a weak tendency for the Democratic vote in gubernatorial elections to vary with turnout rates when those elections are analyzed within the states and over time. But this connection does not exist in all states, the states where it does appear are not sufficiently numerous, and the effect is not strong enough to expect a turnout surge to help Democrats running for a governorship.
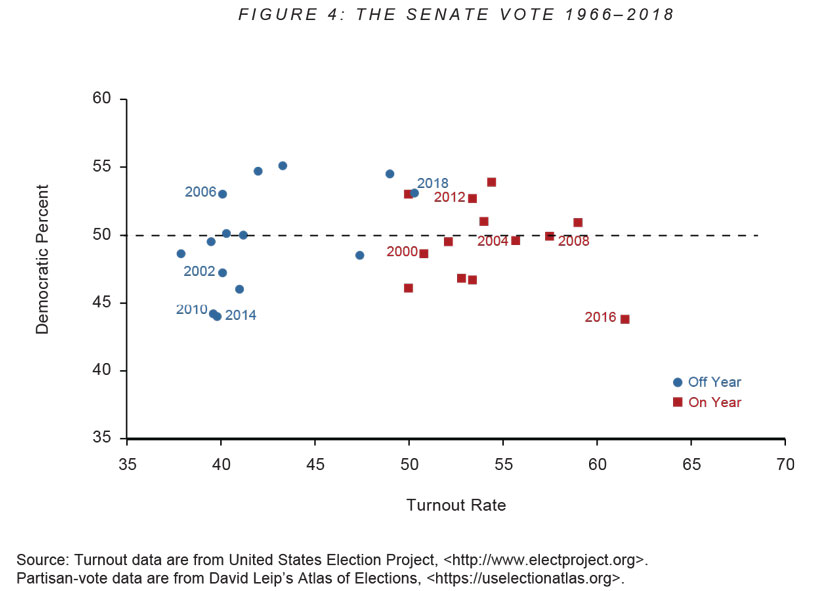
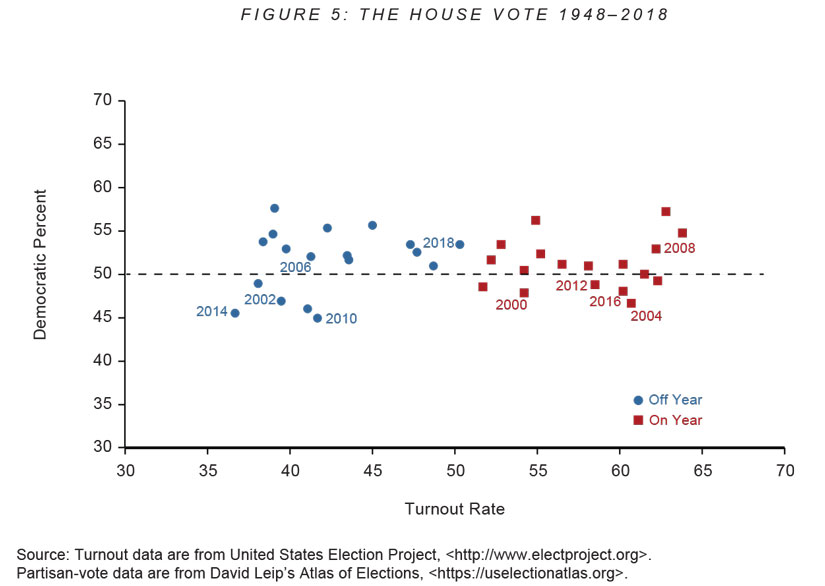
The same pattern characterizes Senate and House elections. As the figures below indicate, there is no trend in the plot of turnout and the Democratic vote that would allow an observer to predict the Democratic vote for the Senate or House based on the turnout rate.
To be sure, these national variances in turnout rate and the Democratic vote do not precisely address the most-asked and most-pressing practical question: If turnout increases, will the Democratic vote in the upcoming Senate, House, or gubernatorial election exceed the Democratic vote in the last election? We examined that question — which generates some complicated data — in our recent book, The Turnout Myth. Suffice it to report here that analyses of individual districts and states across many years confirm the pattern in the figures: Turnout surges and declines do not yield predictable increases or declines in the Democratic vote.
DID LOW TURNOUT DOOM CLINTON?
Perhaps the most commonly cited example of the turnout myth in recent years came in 2016, when many claimed Hillary Clinton would have significantly increased her lead in the national popular vote — and triumphed in the Electoral College — if turnout had been slightly higher across the board. In other words, we are asked to believe that with slightly higher turnout nationally, the Democratic vote share would have increased, and the attendant surge in Democratic votes in Pennsylvania, Michigan, and Wisconsin would have reversed Donald Trump's victory.
Unfortunately, this is another example of a well-ordered hypothesis being undone by messy facts. We can see this by looking at the proportion of Democratic and Republican identifiers at various levels of turnout, and by comparing the candidate choice of an electorate that includes those with a very high likelihood of voting and those with a very low likelihood of doing so.
Recall that, absent STFs that have a strong bias in favor of one of the candidates, Americans tend to vote for the party with which they identify. Contrary to conventional wisdom, the balance between those identifying as Democrats and those identifying as Republicans is almost identical across typical turnout levels. In fact, as we show in our book, the party shares of the electorate remain fairly constant when there is a vanishingly low turnout rate (10%) up to when there is 100% participation.
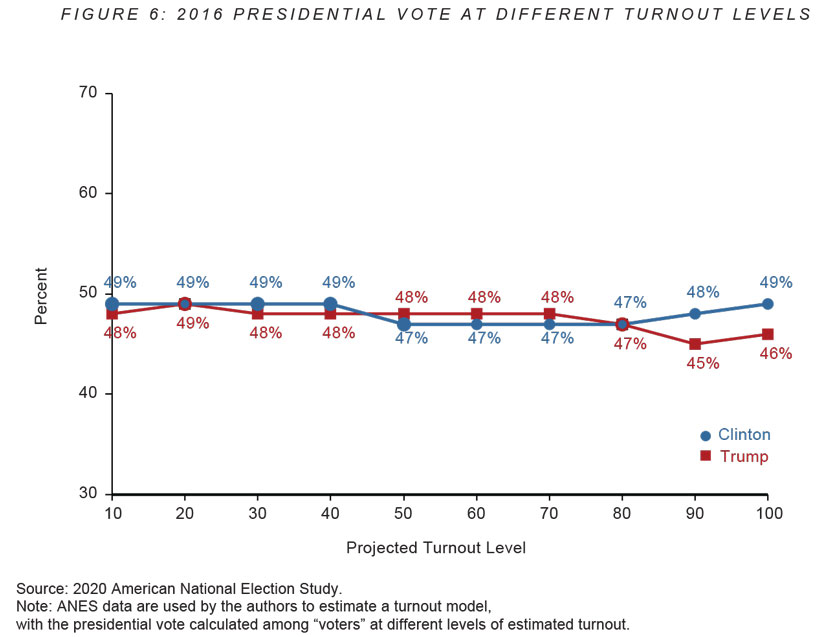
More to the point, the candidate preference of those most likely to vote and those least likely to vote is almost indistinguishable. Drawing on data from the ANES survey, the figure below compares self-reported vote choice and the calculated probability that a respondent was likely to vote in the 2016 election across the full range of turnout rates.
The points along the X-axis in the figure represent a conversion of an estimate of the probability that an individual will vote. The conversion inverts the voting probability and expresses it as a turnout rate. To illustrate, the left-most point on the axis — the 10% turnout rate — represents the assumption that respondents with a calculated voting probability of 0.9 or greater are the only voters. The next point — which appears at the 20% mark — represents the assumption that respondents with a calculated voting probability of 0.8 or greater are the only voters. This logic carries across the graph, with the right-most point on the X-axis representing a turnout rate of 100%.
Though Clinton's margin did widen a bit at the 90% and 100% turnout levels, the dominant feature of the data is that her support hardly varied based on the electorate's size. According to an average of the available polls, the election was a race of between two and three percentage points during the lead-up to Election Day, and it would have provided Clinton with a narrow national-vote win regardless of whether turnout was 33% or 80%. Put differently, Clinton would have had roughly the same popular-vote edge on Trump at any plausible turnout level, and probably for any turnout level within the key states.
DO VOTING-LAW CHANGES MAKE A DIFFERENCE?
In the heated debates over election-law changes this year, the causal model posited (however implicitly) by Democratic lawmakers is that proposed changes to state election laws will reduce voter turnout, and therefore decrease the Democratic vote share. Yet our data on turnout and partisan vote choice unequivocally indicate that there is no reason to expect shifts in turnout to systematically favor either side.
Might it be the case that proposed changes to election laws will systematically and disproportionately disenfranchise would-be Democrats such that they overwhelm the STFs and party defections they engender? We are dubious on this count as well.
Consider the example of Georgia, which introduced strict voter photo-identification requirements for the 2008 elections and purged its voter files of "dead wood" registrants before the 2018 and 2020 elections. In the figure below, we present the relationship between turnout and the Democratic vote share in Georgia from 2000 through 2020. We rely on presidential vote percentages for presidential-election years and gubernatorial vote percentages for midterm-election years.
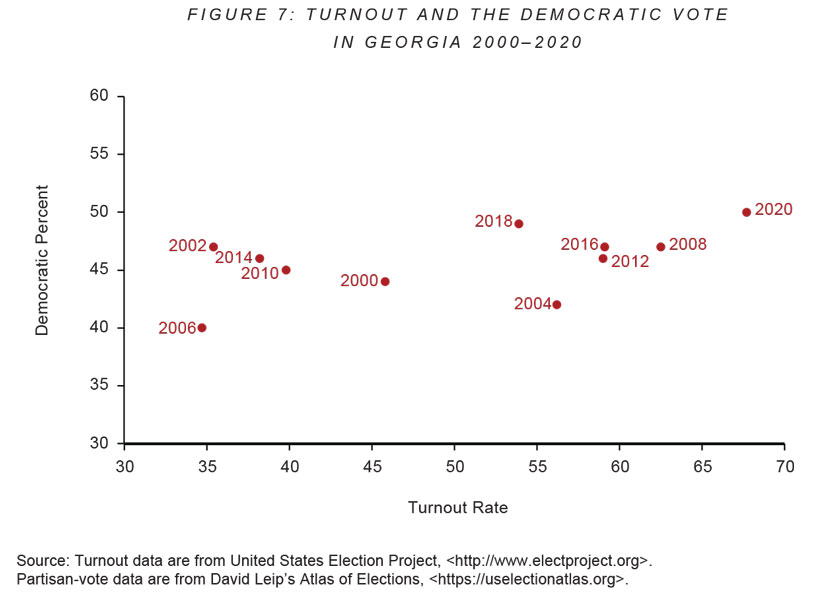
As the figure shows, election reforms do not appear to have resulted in decreased turnout — in fact, the opposite seems to be true. More relevant for our purposes is the fact that the 2006 election (the data point at the lower left of the figure) and 2020 election (the data point at the upper right) create a very slight, positive relationship between turnout and Democratic vote share, with that share increasing by about four percentage points with a 30-point increase in turnout (suggesting that an analysis of these two elections needs to pay some attention to the STFs for those years). But if one were to exclude 2020 or 2006, the relationship would be slight: A 30-point increase in turnout would "raise" the Democratic vote share by about two percentage points. If both elections are excluded, the relationship disappears.
The preponderance of the evidence, along with these illustrative results, suggest that even if changes to election-administration rules have a significant effect on turnout — which itself is far from clear — such changes would not have a readily predictable impact on election outcomes.
BEYOND THE TURNOUT MYTH
Today's partisans are leveling significant vitriol at legislation that may affect voter turnout in elections. But the political calculations at the heart of their wrath are almost certainly incorrect. Seventy years of survey data and election returns suggest that turnout has no systematic partisan consequences. Thus, barring changes in electoral practices, changes in turnout rates will have almost no impact on partisan outcomes.
Having made that statement so unequivocally, we will also acknowledge that turnout can be consequential, and has figured in the political strategy of many, if not most, issue and candidate campaigns. We know of initiatives and referenda where early strategy discussions dealt with when the matter should be put on the ballot based on what surveys indicated about the mood of the electorate. In cases where the surveys indicated that citizens with the highest likelihood of voting supported a proposition while less-likely voters opposed it, proponents sought to place the proposition on the ballot during elections where turnout was expected to be low (usually during local municipal elections or primaries of any kind). Placing a proposition on the ballot during a high-turnout presidential election was favored when supporters believed that those least likely to vote made up the core constituency for the initiative or referendum proposal. Sometimes the strategy worked, and those behind the election scheduling celebrated their insight and political savvy. On occasions when the strategy did not produce the desired outcome, post-election ruminations usually focused on why turnout was higher or lower than expected — for which proponents often blamed the poor quality of the strategist's machinations or the pollster's work.
Turnout levels are also frequently part of the strategies involved in general elections. Campaigns pay consultants to generate ideas for how to register more of their likely supporters and encourage them to turn out on Election Day. In an election where one side overwhelms the other with a "get out the vote" effort, turnout can make the difference, though this is not usually what occurs. Instead, such elections typically become something of an arms race, where get-out-the-vote efforts on one side generate comparable efforts on the other. The result is often a turnout stalemate.
Though the data reported here undermine the turnout-bias thesis, they may suggest new techniques that parties and consultants can explore to ensure their supporters cast a vote. The critical consideration for these strategists should not be the overall turnout rate, but whether those most likely to vote have significantly different preferences on the matters of the moment than those with a weak or no interest in voting.
Grasping the fact that turnout does not have a meaningful partisan valence should encourage everyone in the political system to make voting easier and more accessible. High-turnout elections confer a degree of legitimacy on the outcome of the election as well as the winner's governing choices. This legitimacy is diminished with a low rate of voter participation. The fact that turnout does not inherently favor either party — at least within the bounds of the sort of turnout imaginable in America — should encourage both parties to promote secure voting and broad access to the polls.
As a famous political scientist from an earlier era, V. O. Key, once insisted, "voters are not fools." Political scientists have generally embraced his conclusion. Politicians may wish there were some other way to control election outcomes, but election wins are largely the reward for good governing. Fortunately for all who believe in democracy, turnout offers no path around the basic need to offer voters candidates and policies worth supporting.